 |
| Happy Valentines Day |

INFLATION

The large federal debt and deficit mean that unless our economy grows rapidly, we must inflate, and hence a period of higher inflation is highly likely at some point.
http://noahpinionblog.blogspot.com/2012/07/inflation-predictions-are-hard.html
* Special thanks to "Google Images, "wikipedia.com", "US News & World Report",
and "factcheck.org"
BLOG POST
by Felicity Blaze Noodleman
Los Angeles, CA
2.14.14
Thanks for returning this week! I’m Felicity and I write for the “Noodleman Group” on a range of different topics. Using our resources found Thur Google on our topic for the week we uncover what many people in Washington DC would like to keep covered up. As we look at the subject for discussion we often find other information which politicians certainly are not spotlighting and well; they just wouldn’t talk about at all! This is to say; when the roses don’t smell that great maybe we should see where they are growing! So happy Valentine’s Day and let’s begin.
Most of us have a budget of some sort to calculate how we spend our income. Whether it’s in writing or just a mental note we keep upstairs we meet our expenses on a month to month basis. Hopefully we are able to meet our expenses with something left over that we put away for a rainy day and call it our savings or nest egg.

This is an example of a home budget. When we see where our income is spent we are able
to better visualize where we might better save and more wisely spend our income.
http://office.microsoft.com/en-us/templates/monthly-household-budget-TC101927369.aspx
Since the Government has the most to do with controlling and/or creating inflation we are at the mercy of the Chairman of the Federal Reserve. The Fed controls how much money is printed and the Fed is working for Congress and the President. If you want to calculate the rate of inflation as it relates to your income go to http://www.bls.gov/data/inflation_calculator.htm Let’s say we were making $20.00 Hr. in 2000. Today in 2014 we would need to make in excess of $27.00 Hr. just to keep up with inflation. In other words, somehow we would need to bring in another $7.00 Hr.!

http://www.dailyunconstitutional.com/4589-hyperinflation-in-america-when-a-loaf-of-bread-is-3-billion/
As inflation erodes our income and savings it begins to sound like the video game “Angry Birds”. And why are the birds so angry? Because the pigs are eating their eggs! This is always a problem with our attempts to save and build a nest egg. It seems like everyone, and I do mean everyone knows we have it somewhere and they will try to get it any way possible. From the Government to the Doctor and Dentist, the Grocery and Department stores, the Banks and Financial Institutions and even our Land Lord; everyone is chipping away at our income and savings. The wisest savings alternative is in our Home and Real Estate, but even these have failed in recent years. Inflation is defined by wikipedia.com as follows:

Let's keep track of where we are spending our dollars so they won't end up "going down the drain"!
http://greenvilleneighborhoodplumber.com/plumbing-myths-that-cost-you-money
http://greenvilleneighborhoodplumber.com/plumbing-myths-that-cost-you-money
Inflation
From Wikipedia, the free encyclopedia
 In economics, inflation is a persistent increase in the general price level of goods and services in an economy over a period of time.When the general price level rises, each unit of currency buys fewer goods and services. Consequently, inflation reflects a reduction in the purchasing power per unit of money – a loss of real value in the medium of exchange and unit of account within the economy. A chief measure of price inflation is the inflation rate, the annualized percentage change in a general price index (normally the consumer price index)
 over time.
Inflation's effects on an economy are various and can be simultaneously positive and negative. Negative effects of inflation include an increase in the opportunity cost of holding money, uncertainty over future inflation which may discourage investment and savings, and if inflation is rapid enough, shortages of goods as consumers begin hoarding out of concern that prices will increase in the future. Positive effects include ensuring that central banks can adjust real interest rates (to mitigate recessions), and encouraging investment in non-monetary capital projects.
Economists generally believe that high rates of inflation and hyperinflation are caused by an excessive growth of the money supply. However, money supply growth does not necessarily cause inflation. Some economists maintain that under the conditions of a liquidity trap, large monetary injections are like "pushing on a string". Views on which factors determine low to moderate rates of inflation are more varied. Low or moderate inflation may be attributed to fluctuations in real demand for goods and services, or changes in available supplies such as during scarcities, as well as to changes in the velocity of money supply measures; in particular the MZM ("Money Zero Maturity") supply velocity. However, the consensus view is that a long sustained period of inflation is caused by money supply growing faster than the rate of economic growth.
Today, most economists favor a low and steady rate of inflation. Low (as opposed to zero or negative) inflation reduces the severity of economic recessions by enabling the labor market to adjust more quickly in a downturn, and reduces the risk that a liquidity trapprevents monetary policy from stabilizing the economy. The task of keeping the rate of inflation low and stable is usually given tomonetary authorities. Generally, these monetary authorities are the central banks that control monetary policy through the setting of interest rates, through open market operations, and through the setting of banking reserve requirements.
"wikipedia.com"
Inflation is difficult to write about because for the most part it is invisible. It shows up a little at a time and we usually don’t pay that much attention to it until one day we realize that our wallet has sprung a leak! We’re losing money and we don’t know why. Over the years we are able to begin tracking where our hard earned dollars are going as we begin looking for ways cut our spending and supplement our income to make up for the higher prices we are paying for everything.
To illustrate the problem let us choose the price of gasoline. As a child I remember gas selling for .35 cents a gallon and when we filled up our tank the service station would even give us a set of drinking glasses or maybe savings stamps which could be redeemed for gifts (and this was with full service). Now, today we are sometimes paying upwards of almost $5 dollars a gallon (depending on the driving season) and there are no special deals to spur our buying as we pump the gas ourselves!

http://redbus2us.com/buying-power-of-dollar-vs-rupee-price-of-food-clothes-inflation-usa-vs-india/
This week we have assembled a few articles discussing the phenomenon of inflation. Try as we may to understand it, inflation even defies the understanding of profession economists and even they have different explanations for the direction of the economy.
"US News & World Report"
6 Things That Will Cost More in 2014
Expect prices to rise on a handful of key items, including chocolate, satellite TV and cars.

By Geoff Williams Dec. 31, 2013
Prices will rise in 2014. They always do.
But prices shouldn't climb too much overall, barring any surprising developments that put the U.S. economy into shock. Inflation is low, at 1.2 percent, according to the most recent calculations from the Bureau of Labor Statistics. Still, if all goes as expected, some things will cost more than others in 2014.
So which items might give you sticker shock? To prepare your budget, here's a rundown of things that will likely be more costly in 2014 than they were in 2013.
Food. The U.S. Department of Agriculture predicts that food prices overall will rise about 3 percent in 2014. But some items on the menu – chocolate, beef, bread and cereal – will climb considerably higher.
Why the rise in prices? "Demand is skyrocketing to the point that it outstrips supply," says Michael Levin, assistant professor of marketing at Otterbein University in Westerville, Ohio. He is referring to a cocoa shortage, which caused chocolate prices to creep higher in 2013 over 2012. Some experts are suggesting prices could climb as high as 26 percent in 2014.
"Consumers can expect to pay higher prices for middle and higher premium labels. It will be interesting if mass brands such as M&M's, Hershey's and Snickers pass along those costs," Levin says.
Beef prices for consumers have also been predicted to climb 3 to 6 percent because there is currently more demand than supply. The USDA has suggested that an increase in the cost of wheat and wheat flour may cause bread and cereal prices to rise in the supermarket in 2014, possibly 4 to 5 percent higher than in 2013.
Clothing. Here's your excuse to shop. According to Kristina Michniak, a global apparel manager at Spreadshirt, an e-commerce platform for individuals and companies to sell and buy T-shirts, cotton-based products will likely increase by 5 to 8 percent in 2014.
Why the rise in prices? Blame it on expected unfavorable crop conditions and the need to use the fields for other crops, according to Michniak. She also thinks that simply anticipating the increase of prices will have a psychological effect on manufacturers, many of whom will raise their clothing prices in 2014 regardless.
Houses. This is good or bad news, depending whether you're a seller or a buyer. "Home prices are on the rise and should continue the upward trend due to the previous downturn over the past several years," says George Cook, executive professor at the Simon Graduate School of Business at the University of Rochester in Rochester, N.Y.
Why the rise in prices? "Interest rates still remain very favorable and new builds are picking up steam," Cook says. "The demand for both new and previously owned homes should accelerate rather quickly and increase prices along with it. There is some consumer optimism about the current economy, which will also encourage new buyers into the housing market. No doubt consumers have been holding off on home purchases until they see more positive signs in the economy. This looks like it could be the beginning of the uptick in home purchases, and prices will undoubtedly reach higher levels."
How much higher is hard to say since housing markets differ vastly from state to state, but in the past year, home prices nationwide increased 10.9 percent, according to Clear Capital, which provides real estate data and analysis.
Automobiles. From 2012 to 2013, new-car prices, on average, climbed 1.1 percent, according to the auto industry research company Kelley Blue Book. Prices should rise at least that much in 2014 and possibly more.
Why the rise in prices? "It is estimated that there are 57 new looks that the auto industry will be unveiling. Those new looks drive up prices," Cook says. "And with the demand now catching up with the supply, you'll see fewer consumer incentives, which will result in bottom-line higher prices for most new vehicle purchases."
But it isn't all bad news when it comes to cars. According to the U.S. Energy Information Administration, the cost of gas is expected to decrease in 2014, averaging $3.43 a gallon, just seven cents less than the average cost of fuel at the pump in 2013. Gasbuddy.com, a website that helps consumers find cheap gas, is predicting even less expensive fill-ups at $3.40 a gallon in 2014.
Pay TV. Cable television has hiked its rates considerably in recent years: According to The Wall Street Journal, the average cable bill jumped from $48 in 2001 to $128 a month in 2011. Expect satellite TV, which has been increasing prices around this time each year for some time, to start off 2014 with higher prices.
Both DirecTV and Dish Network are raising their service fees; prices vary depending on the company and packages, but between mid-January and early February, customers can expect to pay about $2 to $5 more a month.
Why the rise in prices? Numerous factors are at play, but most analysts blame it on the rising cost of content. The networks charge the cable companies for the cost of programming, and that cost is passed onto the consumer.
Stamps. As you've likely heard, the price of a first-class stamp will rise three cents on Jan. 26, bringing the cost of mailing a letter to 49 cents. This is a temporary price hike, designed to last two years, and Forever Stamps can be purchased at 46 cents until Jan. 25.
Why the rise in prices? The upward march of stamp prices isn't being blamed on fewer consumers using regular postal mail – although that doesn't help. Rather, the Postal Regulatory Commission approved the believed-to-be temporary increase to help offset $2.8 billion in losses the U.S. Postal Service has taken, stemming from the 2008 recession.
It can be depressing to see prices climbing – especially for those who are cash-crunched or nostalgic for $1-a-gallon gas and 22 cent stamps. But keep in mind that it is actually a good thing for the economy if prices rise – somewhat.
"The benefit of increasing prices is that they encourage spending and economic growth. People are motivated to buy now, otherwise they may have to pay more for the same goods later. The companies selling these goods can then give more people jobs, and the virtuous circle continues," says Gemma Godfrey, the head of investment strategy at Brooks Macdonald Asset Management Ltd., based in London.
But if the idea of higher prices helping the economy doesn't cheer you up, you could do something fun to take your mind off your troubles, like go see a movie. But perhaps you should go soon. Last summer, filmmaker George Lucas theorized to an audience at the University of Southern California's School of Cinematic Arts that the day might not be so far away when people go to a movie theater and pay $50 for a ticket.
http://money.usnews.com/money/personal-finance/articles/2013/12/31/6-things-that-will-cost-more-in-2014?page=2
"US News & World Report"
Some Good and Bad News About Your Paycheck
American workers are earning more than a year ago, but not quite as much as 10 years ago.

By Danielle Kurtzleben May. 16, 2013
It's a perk of an improving job market: as more people have found jobs, workers' pay has also sped past the rate of inflation.
Thursday, the Labor Department released data on both earnings and the consumer price index. The figures show workers' hourly pay ticked slightly upward to $23.87 last month and weekly pay was flat, at $821.13. When adjusted for inflation, however, both figures are up significantly from a year ago. Inflation-adjusted hourly pay was up 0.8 percent in April from one year ago. That's an acceleration from March, when hourly pay had grown 0.4 percent year-over year, as well as February's 0.1 percent. Compare that to April 2012, when pay had fallen by 0.3 percent from the prior year.
A slight reduction in hours meant a slower but still significant boost in real weekly pay last month, up 0.5 percent from one year ago.
The boosts in income may signal that slack in the labor market is easing, at least at little. That's the good news. Now the upsetting part.

That's a chart of median, inflation-adjusted weekly earnings during the last 10 years. Deflation helped to push real wages up in late 2008, but pay has altogether not kept pace with inflation since then.
There are also a couple more dampers on the news of growing paychecks. One is that inflation is slow right now – good news for consumers, but also easy for wages to beat.
"Inflation is so low, that the bar to me isn't that great," says Brad Sorensen, director of market and sector research at the Schwab Center for Financial Research. In addition, volatile gas and food prices play a major role in determining the headline inflation figure. That means that when gas prices are falling quickly, as they have recently, it makes "real" pay bigger, though gas prices could easily turn around and spike.
In addition, pay isn't likely to improve equally for all industries.
"It's very uneven," says Steven Cunningham, director of research and education at the American Institute for Economic Research, a Massachusetts-based economics think tank. "We're seeing much more strength in sectors which use more skilled labor: people with degrees and specialized training. That's where you've got the tight labor market."
In other words, engineers, computer programmers and advanced manufacturing workers can have greater control over their pay than retail workers. Less-skilled workers may have to wait for a significant improvement in the labor market before they see their paychecks grow substantially.
http://www.usnews.com/news/articles/2013/05/16/some-good-and-bad-news-about-your-paycheck
"FactCheck.org"
 Obama’s Numbers
(January 2014 Update)
Obama’s Numbers
(January 2014 Update)
Latest statistics show stagnant wages, persistent long-term joblessness, soaring profits and stock prices, and moderating health care spending.
This report follows our October 2013 update and previous quarterly reports dating back to our first “Obama’s Numbers” article in October 2012. All figures here reflect the most recent available as of Jan. 14.
The average time that an unemployed person in December had been looking for work was 37 weeks, nearly double the average at the time Obama entered the White House.
Another troubling jobs statistic is the civilian labor force participation rate, which has now declined by 2.9 percentage points since Obama became president, to the lowest point since 1978. But that’s not entirely due to “discouraged workers” dropping out because they believe no jobs are available, as some Obama critics would have you believe.
Other labor-force dropouts include members of the baby-boom generation, who are retiring in droves. They also include disabled workers gaining Social Security disability benefits (a number that has doubled in the past 17 years, and is up 20 percent just since Obama took office).
There’s a lively debate among economists about the causes — and implications — of the shrinking participation rate, which started long before Obama took office. The rate actually peaked in early 2000 and declined 1.5 percent under Obama’s predecessor. A Labor Department economist, looking at current demographic trends, predicts further declines through at least 2022 — long after the end of Obama’s presidency.
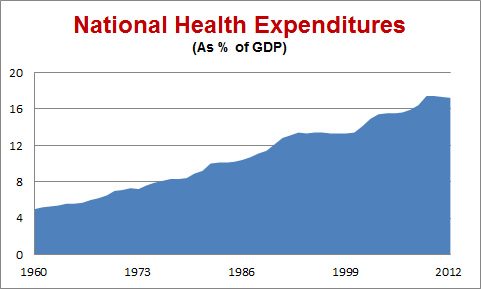
Health care costs have risen only moderately since Obama took office, but not for the reason the White House wants you to think.
The figures show health care spending in the U.S. rose 3.7 percent in 2012, and stood 15.8 percent higher than it did in 2008, the year before Obama took office.
The Health Affairs authors suggested the slowdown in health spending may only be temporary, as has been the case after past recessions.
The highly visible (and highly volatile and highly politicized) price of regular gasoline stood at a national average of $3.33 per gallon in the week ended Jan. 13. That’s more than half a buck cheaper than it was in September 2012, when Republicans were making it an election issue. The recent price is 80 percent higher than it was when Obama took office in the midst of a worldwide recession, which had dampened demand. But the price under Obama has never equaled the historic high of more than $4 per gallon that it reached in June and July 2008, before he took office.
The president has a long way to go to meet his goal of doubling exports of U.S. goods and services, which he first made in his 2010 State of the Union address. So far, exports have increased only 33.6 percent since Obama took office, according to data from the U.S. Commerce Department. (We compared seasonally adjusted figures for the fourth quarter of 2008 with those for the July – September quarter of 2013, the most recent figures available.)
The president is fond of boasting that annual federal deficits are falling rapidly. But they remain large by historical standards. And the fact is, they are piling up.
Total federal debt now stands at nearly $17.3 trillion, which is 63 percent higher than when Obama took office. That figure includes money the government owes to itself, chiefly through the Social Security trust funds.
While cash-strapped state and local governments have been laying off teachers, firefighters, police and other workers, the federal government has increased the number of its employees under Obama.
The figures also show that in recent months state and federal governments have been able to hire back some of their laid-off workers. Obama’s hiring spree also peaked in 2011 (ignoring spikes in hiring of temporary Census workers in 2010), and the number of non-postal federal workers has gone down more or less steadily during the budget battles of the past two years. But the number is above where it was when he took office.
The divide between the affluent and ordinary wage earners — which the president last month called the “defining challenge of our time” — has widened during his time in office.
Wages remain stagnant, barely keeping up with inflation. Average weekly earnings of workers on payrolls, measured in inflation-adjusted dollars, have edged up a scant 0.3 percent between Obama’s first month in office and November 2013, the most recent on record. And there’s no clear upward trend. We reported a 0.1 percent increase in the real earnings figure in our July update six months ago, but that had evaporated by the time of our October update three months later, when the figure was exactly zero.
Relatively fewer people now own their own homes. Under Obama, the home ownership rate has declined by 2.4 percentage points, to 65.1 percent in the July-September quarter, according to U.S. Census figures. (The decline actually began in 2004, when the rate peaked at 69.4 percent as the housing bubble was inflating.)
The increase in food stamp beneficiaries is due partly to economic pressures, but also to liberalizations in both benefits and eligibility under President Obama and also under his predecessor. We covered those in some detail back in 2012 when GOP presidential candidate Newt Gingrich accused Obama of being the “food stamp president.” The number of food stamp beneficiaries increased by 14.7 million during Bush’s two terms in office, and is up another 15.4 million under Obama.
One factor behind Obama’s increase is that benefit levels were raised in 2009 as part of his economic stimulus program. That “temporary” increase was extended several times, and didn’t lapse until Nov. 1 last year.
To be sure, that last quarter of 2008 was the worst since 2002, thanks to the worst business recession since the Great Depression. But profits rebounded to well above previous levels. Profits in the most recent quarter were running 33 percent higher than the highest level seen before 2009, which was the third quarter of 2006, when profits ran at a rate of $1.4 trillion.
Obama’s time in office also has been good for those who own corporate stocks — whose values have doubled and more under Obama. As of the close of the market on Jan. 14, the Standard & Poor’s 500 stock index was 128 percent higher than it was when Obama first took office.
Other market indicators also have soared. The Dow Jones Industrial Average was up 106 percent, and the NASDAQ Composite index had nearly tripled, rising by 190 percent.
As a consequence, U.S. dependency on imported oil has dropped sharply. The nation imported 34 percent of what it consumed in the first 11 months of 2011, according to the most recent EIA figures. (See Table 3.3a, “net imports” as a percent of “product supplied.”) That’s a drop of 23 percentage points from 2008, when the U.S. imported 57 percent. The decline actually began in George W. Bush’s second term, after U.S. dependency peaked at 60.3 percent in 2005. But the trend has gathered momentum under Obama.
As we’ve said before, the U.S. energy boom is a result primarily of the use of new drilling technology by the industry, not of any policy changes in Washington. But the president hasn’t been in any hurry to impose restrictions on the hydraulic fracturing method. The Environmental Protection Agency has been studying the impact of “fracking” on drinking water for years. It announced the study March 18, 2010, and issued a “progress report” Dec. 21, 2012. The EPA says it expects a draft report to be released for scientific peer review sometime this year.
Another factor behind reduced U.S. dependency on imported oil is more fuel-efficient automobiles. The latest figures from the University of Michigan’s Transportation Research Institute show the average EPA city/highway “window sticker” mileage of cars and light trucks sold in December was 24.8 miles per gallon, an improvement of 18 percent over the average for vehicles sold in the month that Obama took office.
Washington is now calling for even greater efficiency in the future. The Obama administration has put in place requirements that cars and light trucks average 54.5 mpg by model year 2025. But it remains to be seen whether the industry can produce such vehicles and get Americans to buy them, and whether future presidents will stick to Obama’s ambitious goal.
Under Obama, wind and solar power has tripled. In the most recent 12 months on record(ending in October) electricity generated by wind and solar had increased by 206 percent over the total for 2008. That was spurred in part by large federal tax subsidies for wind and solar generation.
Despite the large percentage increase in wind and solar generation, such energy accounted for just under 3.2 percent of all electricity generated in the U.S. in the July-September quarter of 2013, the most recent on record. Coal still accounts for the biggest share, followed by natural gas and nuclear power.
The detention facility designed for suspected terrorists remains open at the Guantanamo Naval Base in Cuba, despite the order Obama signed two days after taking office, directing that it be closed within one year. On Dec. 31 the U.S. announced it was releasing three more prisoners — all ethnic Uighur Chinese nationals — and transferring them to Slovakia, which had agreed to resettle them. But that leaves 155 “detainees” in custody (the Pentagon prefers not to call them “prisoners”), a number just 36 percent below the 242 who were being held nearly five years ago when Obama became president.
And the war in Afghanistan grinds on. According to official Pentagon figures, the U.S. has suffered a total of 1,676 military fatalities since 2008 in Operation Enduring Freedom.
Since 2008, a total of 264 U.S. military fatalities were attributed to the two Iraq war operations, Operation Iraqi Freedom and Operation New Dawn, according to official Pentagon figures. Although the last U.S. troops left Iraq at the end of 2011, two deaths were attributed to the conflict in 2012: Marine Staff Sgt. Oscar Eduardo Canon, who died in February 2012 of wounds suffered earlier, and Army Staff Sgt. Ahmed Kousay al-Taie, who had been missing since 2006 and whose remains were identified in February 2012.
"FactCheck.org"
Obama’s Numbers
(January 2014 Update)Latest statistics show stagnant wages, persistent long-term joblessness, soaring profits and stock prices, and moderating health care spending.
·
Posted on January 15, 2014 | Corrected on
January 21, 2014
Summary
As we do every three months, we are updating our “Obama’s
Numbers” report with fresh statistics reflecting what has happened since the
president first took office.
Some highlights from this round:
§ The
economy continues to gain jobs, but the number of long-term unemployed is
nearly double what it was when Obama became president.
§ Wages
remain stagnant, increasing a scant 0.3 percent after inflation during Obama’s
time. Meanwhile corporate profits are running 178 percent higher than just
before he took office, and stock prices have doubled.
§ The
number of low-income persons on food stamps remains just below the record level
reached in 2012, with 15 percent of the population still getting benefits.
§ Health
care spending has increased 15.8 percent under Obama, which is faster than
inflation but modest by historical standards. But there’s scant evidence that
the Affordable Care Act is causing the slowdown. The government economists and
statisticians who track the spending said the law’s impact has been “minimal.”
§ U.S.
exports have gone up just 34 percent — leaving the president far short of his
announced goal of doubling them by the end of this year.
§ The
number of people held prisoner at Guantanamo — which the president once ordered
closed by January 2010 — is down only 36 percent.
§ The
federal debt owed to the public has nearly doubled since Obama was sworn in,
increasing by 95 percent.

Analysis
This report follows our October 2013 update and previous quarterly reports dating back to our first “Obama’s Numbers” article in October 2012. All figures here reflect the most recent available as of Jan. 14.
Jobs
As of December, the economy had gained a net total of 3,246,000
jobs since Obama first took office, and the unemployment rate had fallen to
6.7 percent, down from 7.8 percent.
Despite the gains, more than 10 million people remained
unemployed, including 3.9 million who had been out of
work for 27 weeks or longer. That’s an increase of nearly 1.2 million
“long-term unemployed” since the start of the Obama presidency.
The average time that an unemployed person in December had been looking for work was 37 weeks, nearly double the average at the time Obama entered the White House.
Another troubling jobs statistic is the civilian labor force participation rate, which has now declined by 2.9 percentage points since Obama became president, to the lowest point since 1978. But that’s not entirely due to “discouraged workers” dropping out because they believe no jobs are available, as some Obama critics would have you believe.
Other labor-force dropouts include members of the baby-boom generation, who are retiring in droves. They also include disabled workers gaining Social Security disability benefits (a number that has doubled in the past 17 years, and is up 20 percent just since Obama took office).
There’s a lively debate among economists about the causes — and implications — of the shrinking participation rate, which started long before Obama took office. The rate actually peaked in early 2000 and declined 1.5 percent under Obama’s predecessor. A Labor Department economist, looking at current demographic trends, predicts further declines through at least 2022 — long after the end of Obama’s presidency.
Slowing
Health Care Costs
Health care costs have risen only moderately since Obama took office, but not for the reason the White House wants you to think.
The
most recent official figures were posted by the
Centers for Medicare & Medicaid Services, whose nonpartisan economists and
statisticians have tracked health care spending since 1960. CMS officials also
published their findings in a
Jan. 6 article in the journal Health
Affairs.
The figures show health care spending in the U.S. rose 3.7 percent in 2012, and stood 15.8 percent higher than it did in 2008, the year before Obama took office.
That’s moderate by historical standards. And the White House was
quick to claim credit.
Jason Furman, chairman of the president’s Council of Economic
Advisers, published an op-ed piece in the Wall Street Journal Jan.
6 under the headline, “ObamaCare Is Slowing Health Inflation.” In the body of
the piece, he argued that the slowdown in health costs is due “in part” to the
Affordable Care Act, which he said is making a “meaningful” contribution. He
cited, for example, the law’s provision penalizing hospitals if too many
patients need to be readmitted, which he said has helped reduce hospital
readmission rates by more than 1 percentage point.
But the nonpartisan number-crunchers at CMS said in their Health Affairs article that the ACA had only a
“minimal” impact on the slowdown in spending. The reasons they cited instead
were:
§ The
economic slowdown and subsequent sluggish recovery
§ Drops
in some prescription drug costs brought about by the expiration of patents on
several costly medications including Lipitor, Plavix and Singulair, which are
now available in low-cost generic versions, and
§ A
one-time reduction in Medicare payment levels to skilled nursing facilities.
The Health Affairs authors suggested the slowdown in health spending may only be temporary, as has been the case after past recessions.
Health care spending consumed a record 17.4 percent of the
nation’s entire economic output in the recession-plagued year of 2009. That
declined only slightly, to 17.2 percent, in 2012.
“[T]his pattern is consistent with historical experience when
health spending as a share of GDP often stabilizes approximately two to three
years after the end of a recession and then increases when the economy
significantly improves,” the authors said.
To conclude that the slowdown is permanent, they said, would
require “more historical evidence.”
Moderate
Inflation
Other costs have risen even more slowly under Obama. As of
November, the Consumer
Price Index has risen 10.3 percent since he first took office. Some
policymakers even worry the inflation rate might be too low —
foreshadowing sluggish economic growth in the future.
The highly visible (and highly volatile and highly politicized) price of regular gasoline stood at a national average of $3.33 per gallon in the week ended Jan. 13. That’s more than half a buck cheaper than it was in September 2012, when Republicans were making it an election issue. The recent price is 80 percent higher than it was when Obama took office in the midst of a worldwide recession, which had dampened demand. But the price under Obama has never equaled the historic high of more than $4 per gallon that it reached in June and July 2008, before he took office.
Disappointing
Exports
The president has a long way to go to meet his goal of doubling exports of U.S. goods and services, which he first made in his 2010 State of the Union address. So far, exports have increased only 33.6 percent since Obama took office, according to data from the U.S. Commerce Department. (We compared seasonally adjusted figures for the fourth quarter of 2008 with those for the July – September quarter of 2013, the most recent figures available.)
Obama is facing the same global economic headwinds that he did
six months ago, when we
last updated the export figure. Simply put, overseas customers are
still struggling. European
unemployment is stuck at 12 percent, for example. And China’s
economic growth has slowed and remains problematic. The president mentions
his 2010 National Export Initiative on
occasion. But at the current rate he won’t come close to meeting his
original goal of doubling exports by the end of 2014.
Rising
Federal Debt
The president is fond of boasting that annual federal deficits are falling rapidly. But they remain large by historical standards. And the fact is, they are piling up.
Total federal debt now stands at nearly $17.3 trillion, which is 63 percent higher than when Obama took office. That figure includes money the government owes to itself, chiefly through the Social Security trust funds.
A figure that economists consider more important — the debt the
government owes to the public — has risen even more dramatically. That figure
now stands at $12.3 trillion, an increase of 95 percent under Obama. At the
current rate it will surely rise to a doubling during Obama’s presidency —
possibly by the time of our next update three months hence.
Net interest payments consumed 6.4 percent of all federal
spending in the fiscal
year that ended Sept. 30. And the nonpartisan Congressional Budget
Office officially projects that interest payments will gobble up an even bigger
share of federal spending in the future. “CBO expects interest rates to rebound
in coming years from their current unusually low levels, sharply raising the
government’s cost of borrowing,” CBO said in its most recent long-term
budget outlook document.
Government
Workers
While cash-strapped state and local governments have been laying off teachers, firefighters, police and other workers, the federal government has increased the number of its employees under Obama.
The most recent figures from the Bureau of Labor Statistics show
that as of December,workers on the federal payroll (excluding postal
workers) numbered more than 2.1 million, up 3.2 percent since January 2009.
During the same time, the number of workers on state payrolls went
down 3 percent and those on local government payrolls declined
by 3.5 percent. A big reason for the disparity is that state and local
governments generally must balance their spending and income each year, while
the federal government can keep up spending by borrowing.
The figures also show that in recent months state and federal governments have been able to hire back some of their laid-off workers. Obama’s hiring spree also peaked in 2011 (ignoring spikes in hiring of temporary Census workers in 2010), and the number of non-postal federal workers has gone down more or less steadily during the budget battles of the past two years. But the number is above where it was when he took office.
Stagnant
Wages, Record Corporate Profits
The divide between the affluent and ordinary wage earners — which the president last month called the “defining challenge of our time” — has widened during his time in office.
Wages remain stagnant, barely keeping up with inflation. Average weekly earnings of workers on payrolls, measured in inflation-adjusted dollars, have edged up a scant 0.3 percent between Obama’s first month in office and November 2013, the most recent on record. And there’s no clear upward trend. We reported a 0.1 percent increase in the real earnings figure in our July update six months ago, but that had evaporated by the time of our October update three months later, when the figure was exactly zero.
Relatively fewer people now own their own homes. Under Obama, the home ownership rate has declined by 2.4 percentage points, to 65.1 percent in the July-September quarter, according to U.S. Census figures. (The decline actually began in 2004, when the rate peaked at 69.4 percent as the housing bubble was inflating.)
And the number of low-income persons on food stamps (now called
Supplemental Nutrition Assistance, or SNAP) continues at near-record
levels. The
most recent figures from the Department of Agriculture put the number
receiving benefits at just over 47.4 million as of October — or 15 percent of
the entire U.S.
population.
That’s down a bit from the nearly 47.8 million record set in
December 2012. But it is still an increase of 48.3 percent during Obama’s
presidency.
The increase in food stamp beneficiaries is due partly to economic pressures, but also to liberalizations in both benefits and eligibility under President Obama and also under his predecessor. We covered those in some detail back in 2012 when GOP presidential candidate Newt Gingrich accused Obama of being the “food stamp president.” The number of food stamp beneficiaries increased by 14.7 million during Bush’s two terms in office, and is up another 15.4 million under Obama.
One factor behind Obama’s increase is that benefit levels were raised in 2009 as part of his economic stimulus program. That “temporary” increase was extended several times, and didn’t lapse until Nov. 1 last year.
But while wage earners and low-income people struggle, corporate profits keep setting
records. Even after taxes, corporate profits were running at an annual rate of nearly $1.9 trillion in
the July-September quarter of last year, the most recent for which figures are
available. That’s nearly triple the rate during the three months before Obama
became president — an increase of 178 percent.
To be sure, that last quarter of 2008 was the worst since 2002, thanks to the worst business recession since the Great Depression. But profits rebounded to well above previous levels. Profits in the most recent quarter were running 33 percent higher than the highest level seen before 2009, which was the third quarter of 2006, when profits ran at a rate of $1.4 trillion.
Obama’s time in office also has been good for those who own corporate stocks — whose values have doubled and more under Obama. As of the close of the market on Jan. 14, the Standard & Poor’s 500 stock index was 128 percent higher than it was when Obama first took office.
Other market indicators also have soared. The Dow Jones Industrial Average was up 106 percent, and the NASDAQ Composite index had nearly tripled, rising by 190 percent.
Booming
Oil, Gas, Wind and Solar
The remarkable and historic boom in U.S. oil and gas production
continues. Production of crude oil in the U.S. now has increased 60 percent
since Obama took office, while imports of foreign oil and petroleum products
have declined by 51 percent, as measured by the most recent Energy
Information Administration figures, comparing the most
recent three-month period with the last quarter of 2008.
As a consequence, U.S. dependency on imported oil has dropped sharply. The nation imported 34 percent of what it consumed in the first 11 months of 2011, according to the most recent EIA figures. (See Table 3.3a, “net imports” as a percent of “product supplied.”) That’s a drop of 23 percentage points from 2008, when the U.S. imported 57 percent. The decline actually began in George W. Bush’s second term, after U.S. dependency peaked at 60.3 percent in 2005. But the trend has gathered momentum under Obama.
As we’ve said before, the U.S. energy boom is a result primarily of the use of new drilling technology by the industry, not of any policy changes in Washington. But the president hasn’t been in any hurry to impose restrictions on the hydraulic fracturing method. The Environmental Protection Agency has been studying the impact of “fracking” on drinking water for years. It announced the study March 18, 2010, and issued a “progress report” Dec. 21, 2012. The EPA says it expects a draft report to be released for scientific peer review sometime this year.
Another factor behind reduced U.S. dependency on imported oil is more fuel-efficient automobiles. The latest figures from the University of Michigan’s Transportation Research Institute show the average EPA city/highway “window sticker” mileage of cars and light trucks sold in December was 24.8 miles per gallon, an improvement of 18 percent over the average for vehicles sold in the month that Obama took office.
Washington is now calling for even greater efficiency in the future. The Obama administration has put in place requirements that cars and light trucks average 54.5 mpg by model year 2025. But it remains to be seen whether the industry can produce such vehicles and get Americans to buy them, and whether future presidents will stick to Obama’s ambitious goal.
Under Obama, wind and solar power has tripled. In the most recent 12 months on record(ending in October) electricity generated by wind and solar had increased by 206 percent over the total for 2008. That was spurred in part by large federal tax subsidies for wind and solar generation.
Despite the large percentage increase in wind and solar generation, such energy accounted for just under 3.2 percent of all electricity generated in the U.S. in the July-September quarter of 2013, the most recent on record. Coal still accounts for the biggest share, followed by natural gas and nuclear power.
War
and Terrorism
The detention facility designed for suspected terrorists remains open at the Guantanamo Naval Base in Cuba, despite the order Obama signed two days after taking office, directing that it be closed within one year. On Dec. 31 the U.S. announced it was releasing three more prisoners — all ethnic Uighur Chinese nationals — and transferring them to Slovakia, which had agreed to resettle them. But that leaves 155 “detainees” in custody (the Pentagon prefers not to call them “prisoners”), a number just 36 percent below the 242 who were being held nearly five years ago when Obama became president.
And the war in Afghanistan grinds on. According to official Pentagon figures, the U.S. has suffered a total of 1,676 military fatalities since 2008 in Operation Enduring Freedom.
Since 2008, a total of 264 U.S. military fatalities were attributed to the two Iraq war operations, Operation Iraqi Freedom and Operation New Dawn, according to official Pentagon figures. Although the last U.S. troops left Iraq at the end of 2011, two deaths were attributed to the conflict in 2012: Marine Staff Sgt. Oscar Eduardo Canon, who died in February 2012 of wounds suffered earlier, and Army Staff Sgt. Ahmed Kousay al-Taie, who had been missing since 2006 and whose remains were identified in February 2012.
– by Brooks Jackson
Correction, Jan. 21: In our original story we
referred to all those held at Guantanamo as “suspected terrorists.”
Actually, roughly
half those being held have been cleared for release, either
because they were found not to have been fighting against the U.S. in
the first place, or because they were no longer considered a threat.
According to a Congressional
Research Service report from May 2013, the prisoners
include “[p]ersons who have been cleared for transfer or release to a foreign
country, either because (1) they are not believed to have been engaged in
hostilities, or (2) although they were found to have been enemy belligerents,
they are no longer considered a threat to U.S. security.”
http://www.factcheck.org/2014/01/obamas-numbers-january-2014-update/


http://www.factcheck.org/2014/01/obamas-numbers-january-2014-update/
Now that we have a better understanding of inflation and the
problems that it creates hopefully we will not be as vulnerable when it strikes
our finances. We have our inflation
calculator, our budget template from Microsoft and we have some professional advice to guide us for the year ahead. The best advice about protecting yourself
against inflation starts with your budget.
Try to plan ahead by creating what economists call a “Hedge”. The Best Hedge is your savings – put away
every spare dollar. Remember; there is really
no such thing as disposable income, every dollar counts!
The next Hedge and possibly the biggest Hedge or protection
we have against inflation is our home and real estate. While inflation is eroding everything else in
our finances inflation is pushing up the value of your house and other real
estate you own while your payments on the property should stay the same. When you eventually sell your real estate you
will reap a healthy profit.
One last Hedge we could create for ourselves is with our
cars and it’s really hard to do since automobiles are such a status symbol for
most people. Transportation is probably
the biggest expense most of us have. Car
payments, leases, Insurance, gasoline and maintenance are all very
expensive. The first tip is don’t spend
more than you are able to afford. Don’t
drive a BMW when all you are really able to afford is a Chevrolet.
Next; try to keep your present automobile for as long as possible; remember that inflation is pushing new auto prices up. If your car is running well and maintenance is low, keep it. This car is saving you big money! A good rule of thump about new cars is to know that when you have purchased a new automobile it's value drops by almost 50% as soon as you drive it off the dealers lot. If you take good care of your car it will probably give you many years of good service. So remember these good tips to follow:
Next; try to keep your present automobile for as long as possible; remember that inflation is pushing new auto prices up. If your car is running well and maintenance is low, keep it. This car is saving you big money! A good rule of thump about new cars is to know that when you have purchased a new automobile it's value drops by almost 50% as soon as you drive it off the dealers lot. If you take good care of your car it will probably give you many years of good service. So remember these good tips to follow:
- Don't live above our means
- Don't live from paycheck to paycheck
- Save whenever possible
- Invest wisely in our homes and real estate
- Keep those transportation expenses low
- Beware of creative financing schemes
This
has been Felicity writing for the “Noodleman Group” and have a happy Presidents
Day. See you Next week!
PRESIDENTS DAY! - February 17, 2014
http://www.educationgrant.com/2010/02/15/presidents-day-tips-for-applying-to-scholarships/
http://www.educationgrant.com/2010/02/15/presidents-day-tips-for-applying-to-scholarships/
Tell your friends and associates about us!
It's easy! Just copy and paste me into your email!
* “The Noodleman Group” is pleased to announce that we are now carrying a link to the “USA Today” news site.We installed the “widget/gadget” August 20, and it will be carried as a regular feature on our site.Now you can read“Noodleman” and then check in to “USA Today” for all the up to date News, Weather, Sports and more!Just scroll all the way down to the bottom of our site and hit the “USA Today” hyperlinks.Enjoy!
No comments:
Post a Comment